Function -
Basic Spectrum
Analyzer
(with optional Signal Generator)
Created
Dec 16, 2009
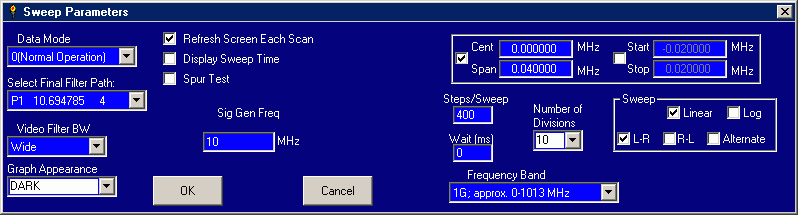
The Function
of Basic Spectrum Analyzer is available for all construction
Levels of the MSA. All MSA Build Levels refer to this
page when operating
as a Basic Spectrum Analyzer. For MSA's other than the
Basic MSA, the
Signal Generator is active and can be commanded to any frequency
between 0 Hz and 3000 MHz.